137
merged pull requests
736
automated tests
8
architecture decisions
Transparency note. This work was carried out on a personal basis, for learning purposes, with the help of an AI:
- for the code and the technical and methodological review;
- to understand the tools and the mathematical methods;
- for help with writing, translating and correcting the text;
- to generate the cover image of this page.
The choice of topic, the protocol, the checking of the results and the conclusions are mine, and so are any mistakes. How I use AI
The problem#
Consumer budgeting apps almost all ask for the same thing: access to your bank accounts, and hosting your financial history on their servers. Spreadsheets ask for nothing, but get abandoned after three months: entry is slow, and the totals break at the first copy and paste.
I wanted a tool in between:
- private by design: the data stays on a household machine, with no telemetry and no third-party service;
- quick to keep up: one entry session a week, at the keyboard, with nothing to sort afterwards;
- exact to the cent: every total must be recomputable from the lines entered;
- looking ahead: tell whether the household’s plans will be funded on time, and where its net worth could go;
- ready for data science: simulation, forecasting and a natural-language assistant must be addable without rebuilding the foundations.
It is also my first product: a project meant to last, not a throwaway experiment. So it is where I apply my way of working with Claude Code.
Where the project stands#
Phase 0 · Foundations
Shipped
Technical groundwork
Specifications, architecture and decisions written before the first line of code. Repository, tooling, continuous integration, Docker Compose stack, Claude Code configuration and a visual identity borrowed from this blog.Phases 1 and 2 · Budget
Shipped, then redone
The heart of the product
Two-factor authentication, household and invitations, accounts, bank import and reconciliation, categorisation rules, transfers, budget plans by period with their review, recurring items, reports and an activity log. The whole accounts-and-import side was later replaced by the v1.0 redesign.Phase 3 · Net worth
Shipped
Assets and liabilities, month by month
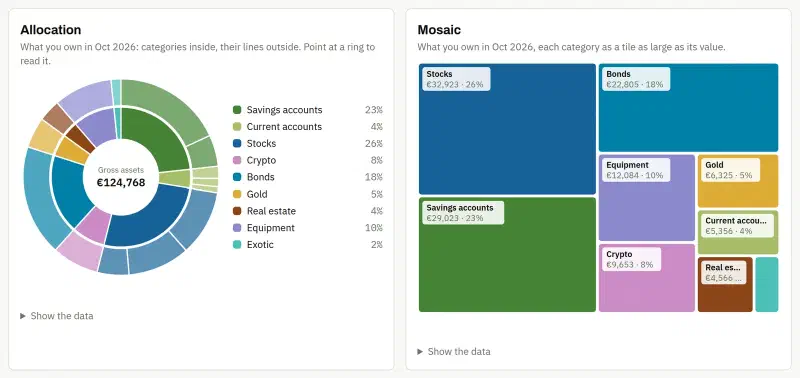
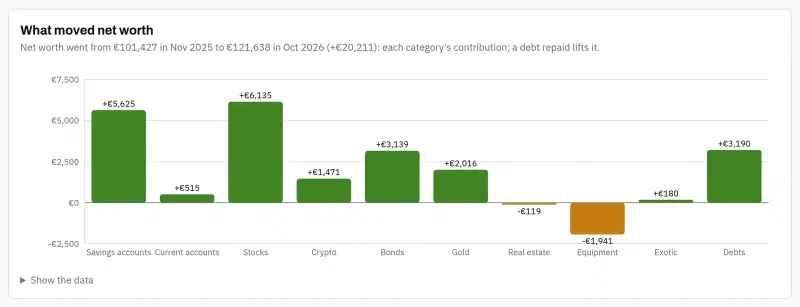
A monthly net-worth matrix: categories and lines entered by hand, debts, net worth, and four charts (history, allocation as a sunburst and a mosaic, contributions to the change).Phase 4 · Financial goals
Shipped
An amount to gather by a date
Goals arranged in a pyramid (the emergency fund as its foundation, then long, medium and short term, under a golden capstone for treats), funded by envelopes taken from the net-worth lines, with monthly tracking and an effort plan for the month.v1.0 redesign · Simpler spending
Shipped
What I actually do, not what I had imagined
No more accounts, import or transfers: every expense is a line entered by hand, in a grid built for the keyboard. One level of categories, fixed expenses to confirm, monthly targets with their matrix and a year view. The spending data starts afresh.Phase 5 · Analytics and data science
Under way
Where my trade comes in
Shipped: the goals analysis (six views and points to look at, computed by rules) and the Monte Carlo engine of the net-worth projection. Next: the projection page, the chance of reaching each goal, retirement, then cash-flow forecasting once the spending has enough history.Phase 6 · Local generative AI
Planned
With nothing leaving the machine
An assistant that answers natural-language questions about your own data, using a local language model (Ollama), restricted to a read-only analytics view.
Why bank import went away#
Import was where the project started: drop in the bank’s CSV export and let the rules sort the
expenses. In practice, I already entered my expenses by hand every week, and the statement then
arrived as a chore: rows to sort again, duplicates of what was already entered, a reconciliation
to check. So v1.0 removed accounts, import, transfers, rules, recurring items, the budget month
and the plans, with their data, to keep what is useful: quick entry and a readable budget. The
deviation is logged in the repository’s README, like every deviation from the original plan.
What works today#
One household, three points of view#
The owner creates the household and invites the other members with a single-use link; there is no public sign-up. Login with a password (argon2id) and a mandatory TOTP code.
Spending belongs to the household: every member sees and edits every line. Net worth and goals, on the other hand, have a visibility, line by line:
- private: only its owner sees it;
- shared: the whole household sees it, but it still belongs to its owner;
- joint: the household’s common holding, which belongs to nobody.
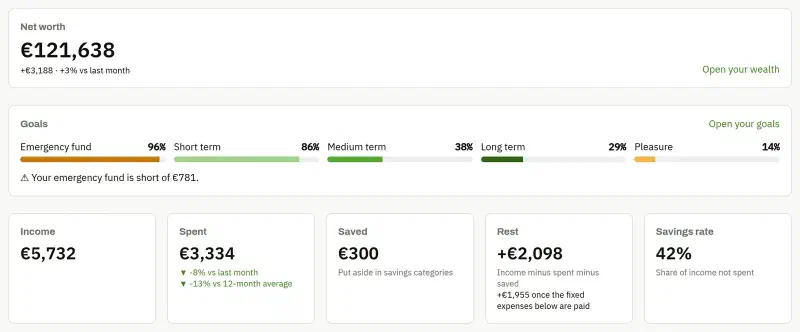
Net worth and goals can then be read at the level of the household, the joint holdings or my lines. The app is arranged in three spaces, Spending, Wealth and Goals; the overview, at the top, sums up all three.
Quick entry, at the keyboard#
The spending space’s main page is a grid: one month, its lines, every cell editable in place. An empty row always waits at the bottom; Tab moves to the next cell, Enter saves and opens a new row with the same date. Everything works without the mouse.
Above it, a quick line takes an expense typed in any order: bakery 12.50 yesterday,
45 train 13/10 or groceries 87.40 #home.
- the date is recognised (“yesterday”, a weekday,
dd/mm); - the amount is the last number, the others stay in the label;
#wordforces the category that starts with that word;- the rest is the label, and its category comes from the label memory: picking a label already used brings back the category of its latest line.
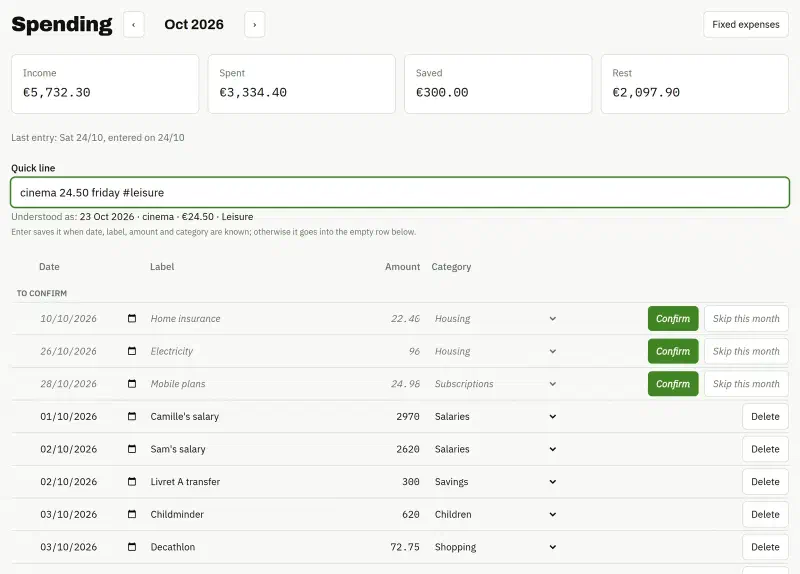
A header recalls the last line entered and when, and a dot marks it in the grid, to pick up where you stopped.

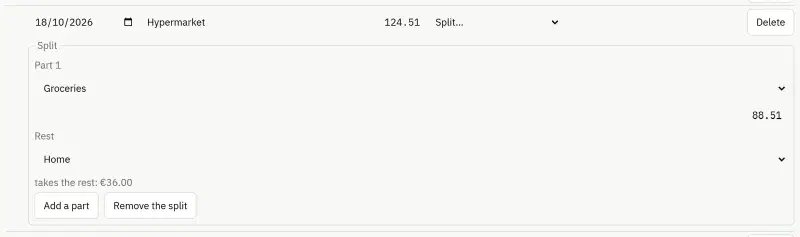
A line can also be split across several categories: the last part takes the rest, so the sum always comes out exact.
Categories of three kinds#
One level of categories, each of a kind:
- expense: rent, groceries, leisure;
- savings: money put aside, never spending, but it reduces the month’s rest;
- income: salaries, benefits, refunds.
A month’s income is the sum of its income lines, and the rest is income minus spending minus savings. One-off categories (rent, subscriptions), paid in one go, are never judged against the pace of the month.
Fixed expenses#
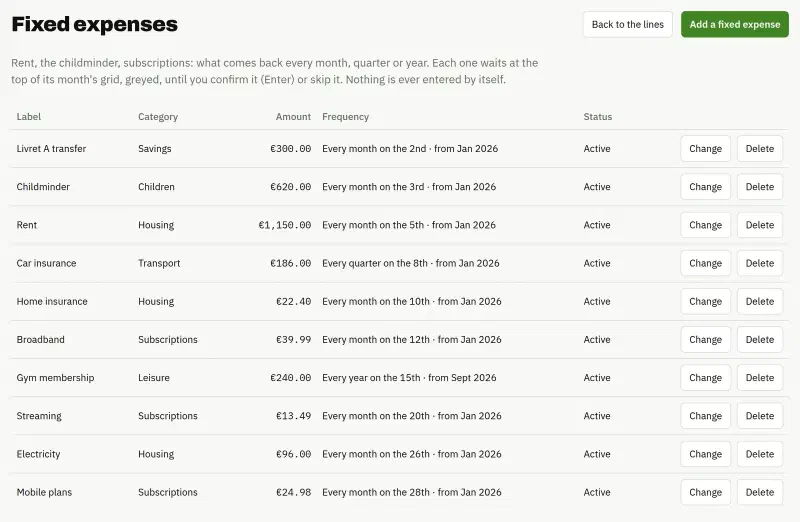
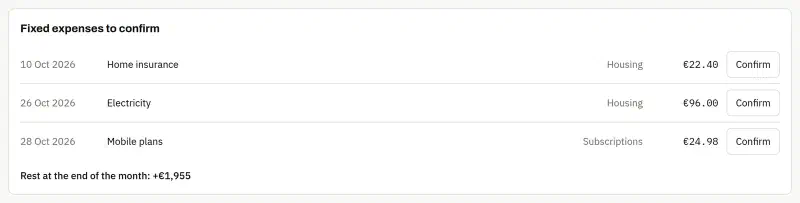
Rent, the childminder, subscriptions, insurance: a fixed expense describes a line that comes back every month, quarter or year. Each occurrence due shows greyed at the top of the month’s grid. Enter confirms it and creates the line, editable first; it can also be skipped for the month. Nothing is ever created by itself.
The overview lists what is still to confirm and the projected rest at the end of the month.
Monthly targets#
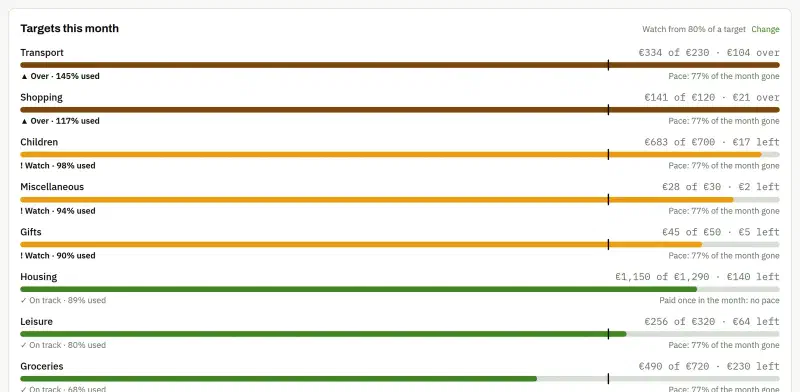
Each expense category can get a monthly target, set from a month on and kept until changed; past months keep theirs. A savings category gets a minimum to reach.
- the month so far, on the overview: one bar per category, ranked by share used, with a mark for the share of the month elapsed, so spending ahead of the calendar shows before it overruns;
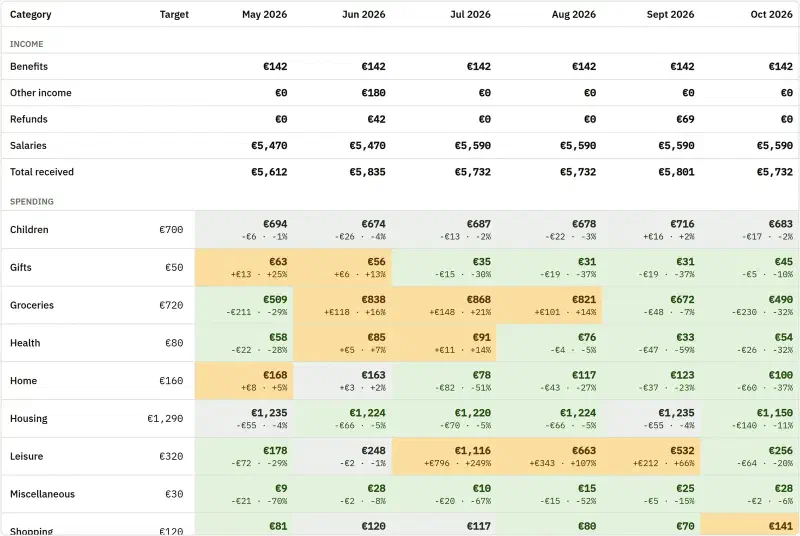
- the matrix: one row per category, one column per month, each cell coloured by its gap to the target (green below, grey within ±5 %, burnt orange above);
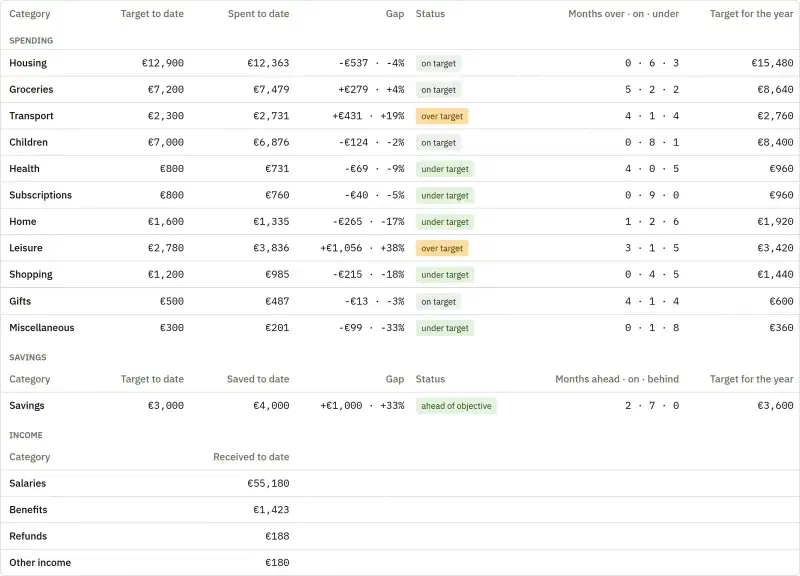
- the year: the targets to date and for the whole year, the gap, and how many months were over, on or under target.
Reports over any period#
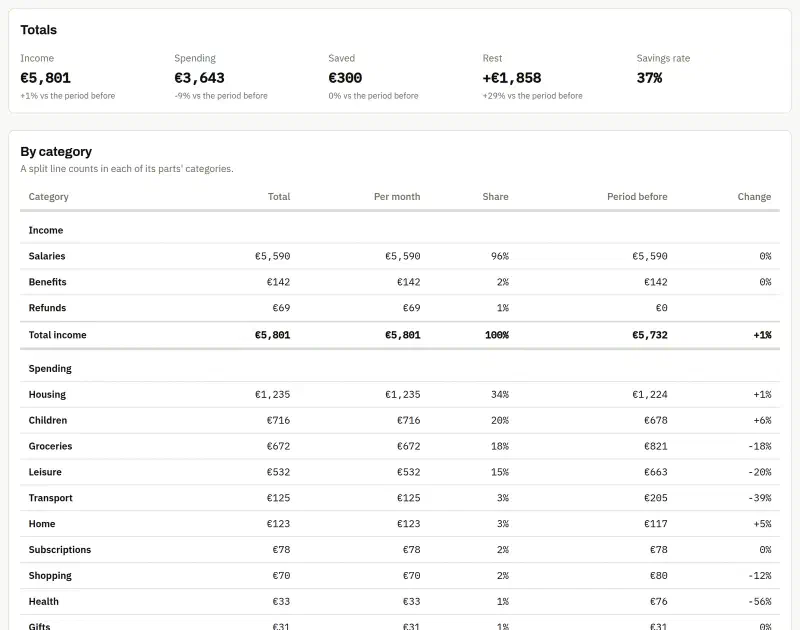
A month, a quarter, a year or any period up to ten years, compared with the previous period of the same length. A running period stops at the current month: “this year” is compared with the same months last year, not with a whole year.
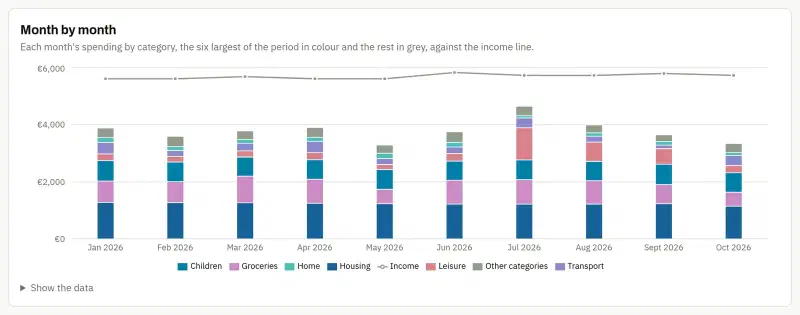
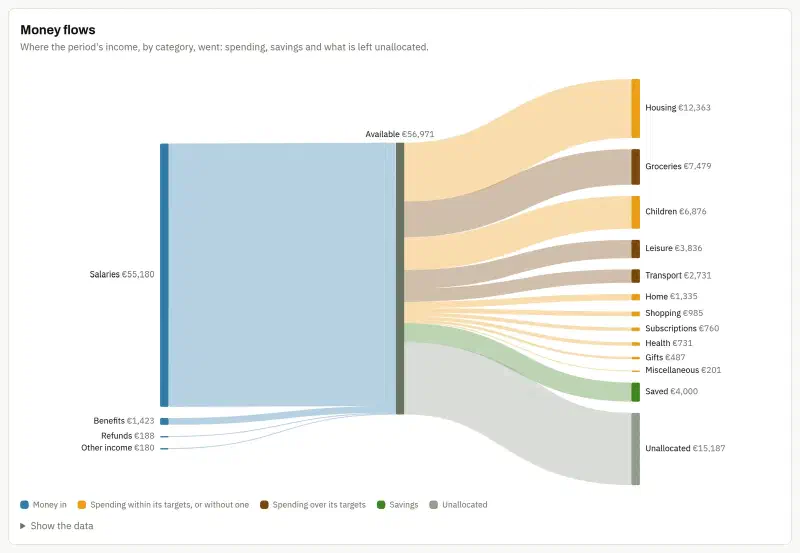
A report also gives a monthly chart stacked by category, spending accumulated day by day, and the period’s money flows: income on the left; spending, savings and the unallocated rest on the right, both sides always adding up to the same total.
Net worth, month by month#
Net worth is tracked as in a spreadsheet: one line per holding, filed in a category, one column per month, and a value entered by hand once a month.
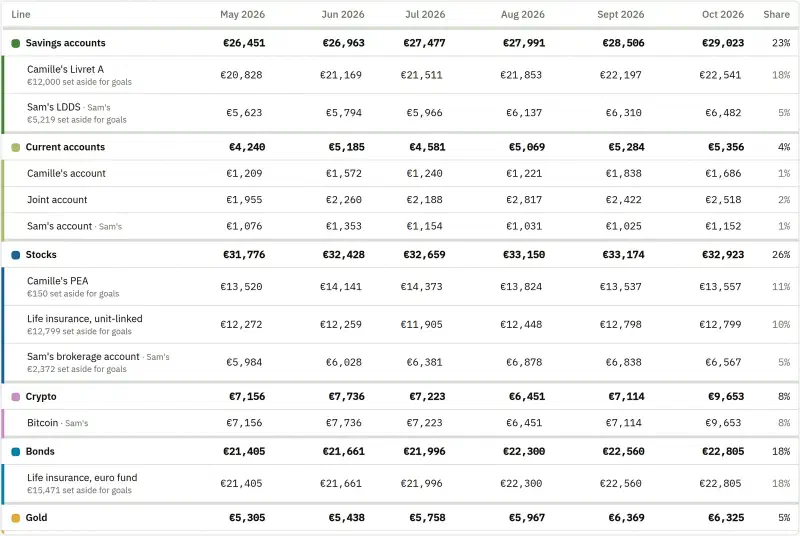
- a month without a value carries the previous one forward, shown as carried;
- “Update this month” lists every line with its last value, to enter them all at once;
- each line has an owner and a visibility;
- a regulated savings account (Livret A, LDDS, LEP, PEL, Livret jeune) knows its ceiling.
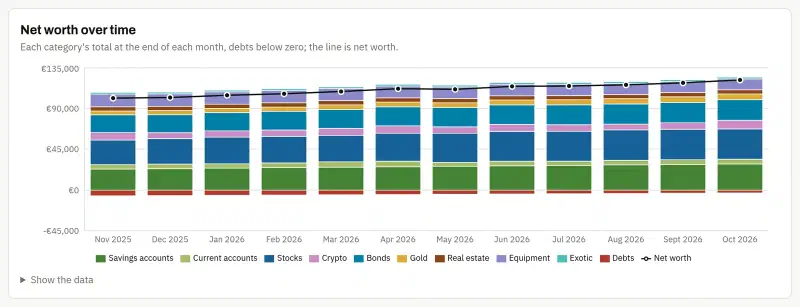
An Analysis page gives four charts, each category in its colour. Since ten hues cannot all stay apart for every colour-vision deficiency, every chart also keeps its labels and its data table.
Goals, in a pyramid#
A goal is an amount to gather by a date: an emergency fund, a trip, a home deposit. Goals are arranged in a pyramid, drawn in stone:
- the foundation is a Roman column: the emergency fund, filled first. The app proposes its amount, six months of fixed expenses by default;
- three tiers, set by the deadline and never chosen: the long term (beyond five years) at the base, the medium term in the middle, the short term (twelve months at most) at the top. A goal climbs a tier by itself as its deadline nears;
- a golden capstone for treats (boxing gloves, a record player, a fine bottle of rum), with no deadline, locked until the essentials are in order: the emergency fund full and at least three quarters of the goals ahead.
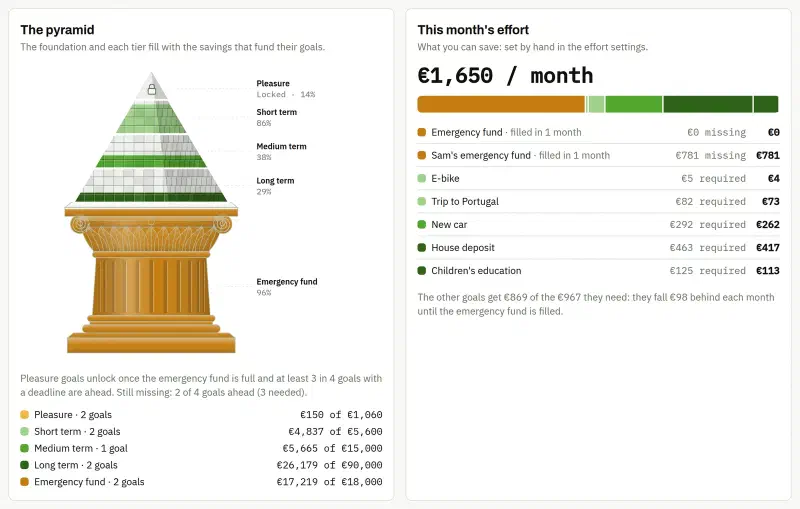
A goal needs nothing more to enter: it is funded by envelopes, the part of a net-worth line set aside for it. When the line rises, each goal receives its share of the rise; when it falls, the fall comes out of the free part first, and goals only lose once the line drops below what they hold, treats first and the emergency fund last.
flowchart LR
    L["Net-worth line
Euro-fund life insurance"] -->|50 % of rises| A["Envelope
Trip to Portugal"]
    L -->|30 % of rises| B["Envelope
New car"]
    L -->|20 % of rises| C["Envelope
Home deposit"]
    L -.->|falls first| F["Free part"]
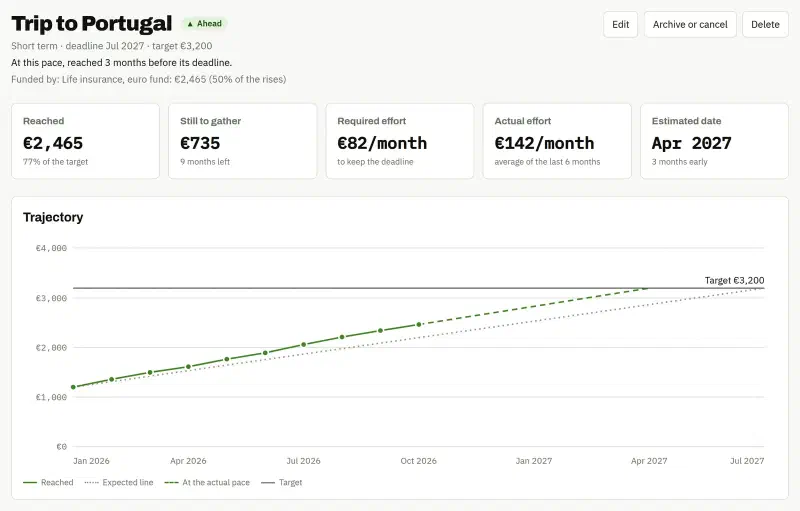
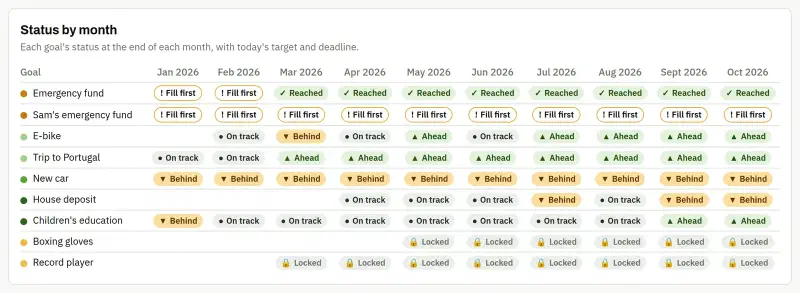
Each goal has its status (reached, ahead, on track, behind), against a straight path from start to target, and its estimates: the monthly effort required, the actual effort over the last six months, the estimated date at that pace. The month’s effort plan shares out the household’s savings capacity: the emergency fund first, up to an adjustable share, then the other goals by their required effort, then the unlocked treats. It is a recommendation: nothing is moved.
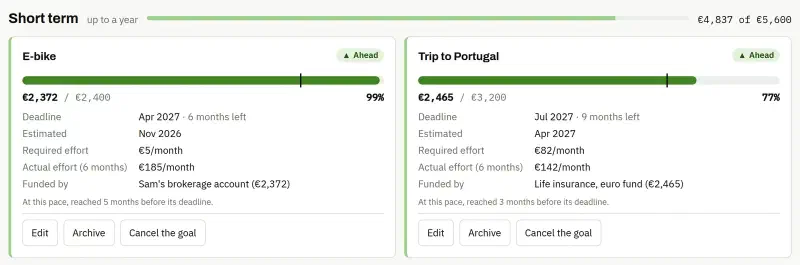
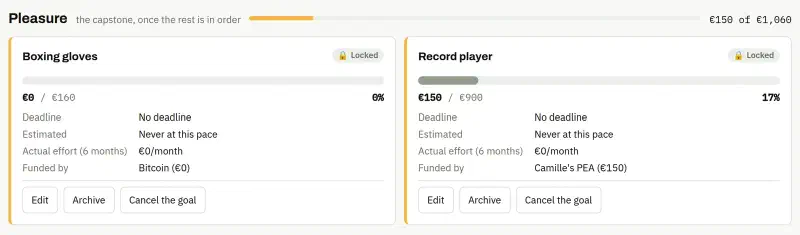
Each goal also has its page: its estimates, its trajectory, its envelopes line by line and its month-by-month tracking.
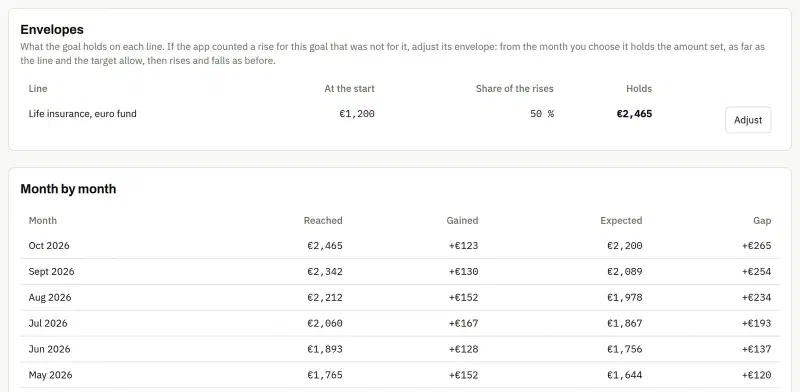
The goals analysis#
An Analysis tab looks at the goals together, at a reference month: the last month in which every line funding them has a value entered, so that a month not yet entered never passes for a month without gain.
- required effort against capacity over the next two years, over-committed months shaded;
- a timeline: each goal from its start to its deadline, with its estimated date at the actual pace and at the plan’s pace;
- horizon and risk: each goal placed by the months left and the volatility of its envelopes, with zones to watch (short and volatile, long and eroded by inflation) and the loss in one outcome in ten;
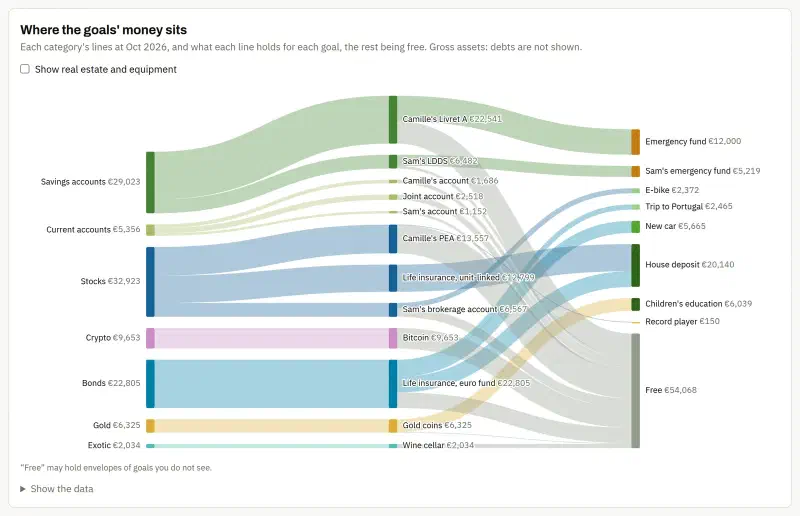
- where the money sits: a flow diagram from categories to lines, then to the envelopes and the free part;
- status month by month for each goal.
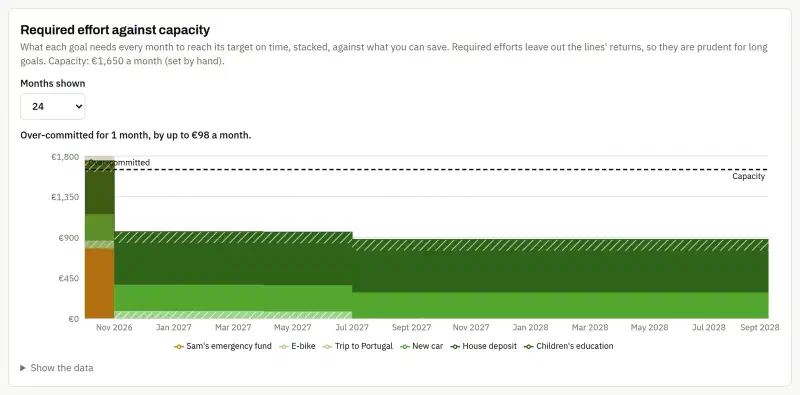
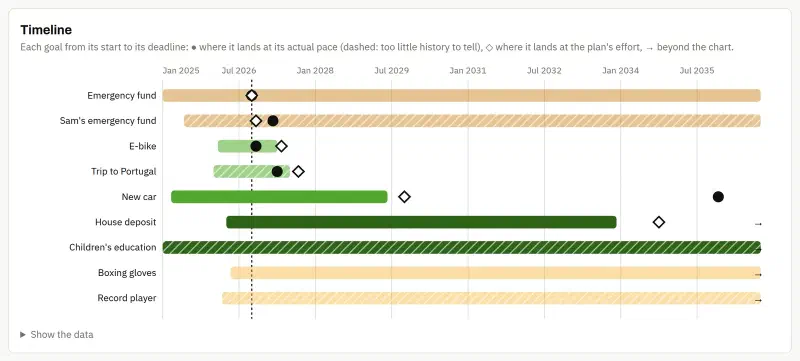
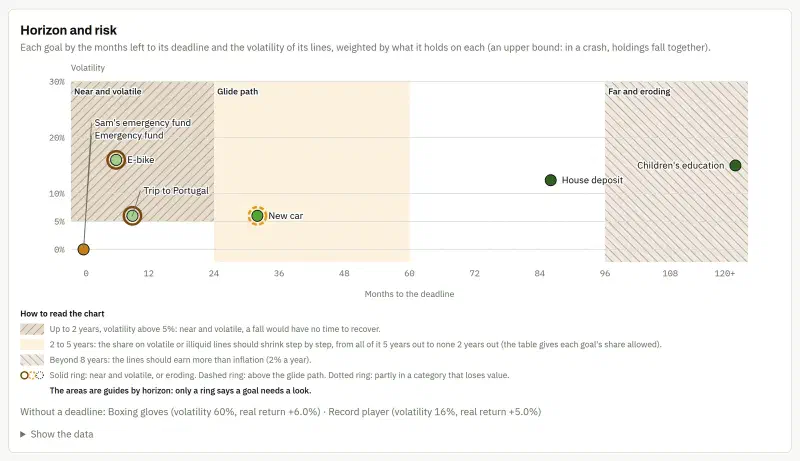
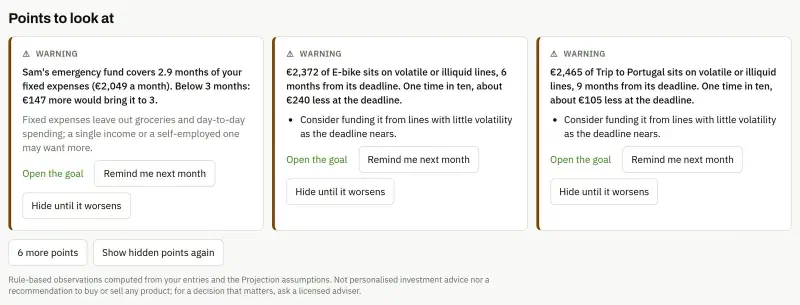
Above them, points to look at, computed by some fifteen fixed rules: a goal behind for three months, an emergency fund too thin or held on volatile lines, a savings account close to its ceiling, money idle on a current account, goals that ask for more than the capacity (with the postponement that would be enough). Each point gives the facts, the figures, why it matters and options; never an instruction to buy or sell, nor a named product. Three at most are shown, and each member can snooze or dismiss one.
Verified backups, logged actions#
A full backup every night, checked before it is kept, with rotation (7 days, 4 weeks, 12 months) and a written restore procedure.
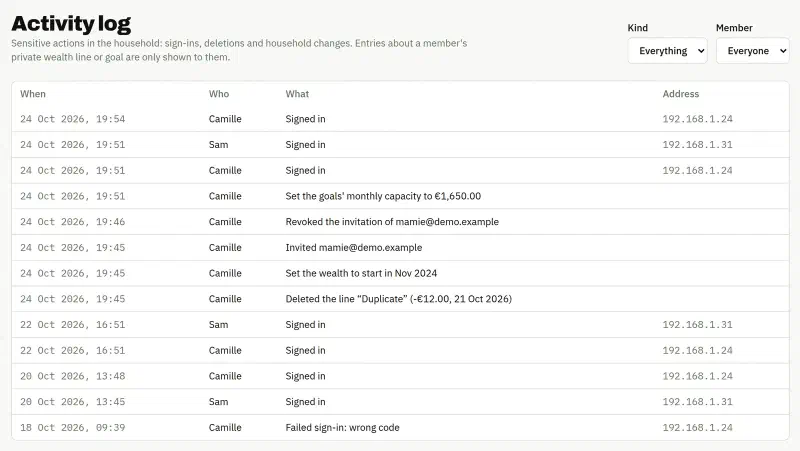
An activity log keeps sensitive actions, written in the same transaction as the action itself: sign-ins, invitations, deletions. The owner sees the whole household, a member their own entries.
How it is built#
A simple architecture, designed for what comes next#
Everything starts from a single docker compose up: a Caddy proxy with TLS on the local network,
a FastAPI API, a PostgreSQL database and a backup service. The React interface is served from the
same origin as the API, which allows cookie sessions with no CORS configuration.
flowchart LR
    N["Browser
local network"] -->|HTTPS| C["Caddy
TLS + React interface"]
    C -->|/api| A["FastAPI API
kwak_api"]
    A --> K["kwak_core
all the business rules"]
    A -.->|page to come| M["kwak_analytics
Monte Carlo, NumPy"]
    M --> K
    A --> P[("PostgreSQL")]
    S["Nightly backup
checked pg_dump"] --> P
On the Python side, the code is split into packages with a strict rule: kwak_core holds all
the business rules (amounts, the quick line, splits, monthly targets, fixed expenses, reports,
net worth, envelopes and the effort plan, the analysis rules) and depends on nothing. It is tested
without a database. The API and the kwak_analytics layer depend on it, never the other way
round: a given figure has only one definition.
The contract between the API and the interface is the OpenAPI schema: the TypeScript client is generated from it, never written by hand. CI fails if someone forgets to regenerate it.
Money does not tolerate “roughly”#
Amounts are exact decimals (Decimal in Python, NUMERIC in the database), never floats. And the
rules that must always hold are written in the specifications, then checked by property tests
(Hypothesis): instead of a few hand-picked examples, the test generates hundreds of cases and
looks for the one that breaks the rule.
| Invariant | What the test checks |
|---|---|
| Quick line | Every word typed ends up in exactly one field: date, amount, category or label |
| Splits | The parts of a split line add up exactly to its amount, each positive |
| Savings | Savings are never spending, and the month’s rest is the sum of its lines |
| Monthly targets | One target in force per category and month, and the yearly target is the sum of the months |
| Fixed expenses | A line fulfils at most one occurrence, and the projected rest deducts exactly those left |
| Consistency | A report, the matrix, the year and the month so far always give the same figures |
| Flows | Both sides of the flow diagram add up to the same total |
| Net worth | A month’s net worth equals its assets minus its debts, and the household is exactly the sum of its scopes |
| Envelopes | A line’s envelopes are never negative and never exceed its value, nor a goal its target |
| Effort plan | The plan never hands out more than the capacity, and the emergency fund is served first |
| Capstone | A locked treat receives nothing, neither from rises nor from the plan |
| Analysis | A goal’s weights on its lines sum to 1, and the postponement proposed is enough, one month less is not |
| Projection | With no volatility, every path matches the exact calculation; money is conserved every month |
API tests run against a real PostgreSQL started in a container, never against a mocked database.
A Monte Carlo projection#
The first piece of phase 5 is the engine that will tell where net worth could be in 1 to 40 years. The starting point is the current month of the matrix; each category has an expected return and a volatility, both adjustable, and the household’s monthly savings are added every month, shared across the categories.
- 5,000 paths, month by month: each category grows by a lognormal return drawn from its own random stream, calibrated so that twelve months compound to exactly the chosen annual mean and volatility;
- a fixed seed: the same assumptions always give the same result, and two scenarios share the same draws, so their difference comes from the assumptions only;
- debts are repaid by their monthly payment and rate, and what they free joins the savings;
- negative savings draw on current accounts then savings accounts, never on the home or locked-in holdings; what is missing becomes a debt borrowed at 8 %.
It is the one place where money goes through floating point, for speed: the inputs are Decimal,
and the results come back to it, to the cent. The projection’s invariants (money conserved,
ordered percentiles, identical paths with no volatility, simulated mean equal to the chosen
return) are tested like the rest, and an engine version is pinned by a golden test.
Decisions written down#
Every structural choice gets a decision record (ADR), dated, with its rejected alternatives. A decision that changes gets a new record; the old one is never rewritten.
| Decision | Rather than |
|---|---|
| Self-hosting with Docker Compose | Cloud hosting: needless cost and exposed financial data |
| FastAPI, SQLAlchemy 2, Alembic | Django: heavier, and the admin interface is of no use |
| PostgreSQL, then DuckDB for analytics | SQLite alone: concurrent writes, no vector extension |
| Euro only | Full multi-currency accounting, too costly for a single real need |
| Server sessions and mandatory TOTP | JWT tokens, hard to revoke |
| Local language model (Ollama) | A cloud API: the data must never leave the machine |
Deviations from the original plan are logged in the README too, to the day.
What’s next#
The projection engine is ready: what is left is its page, a fan of possible outcomes (median, 25–75 % and 10–90 % bands), the chance of reaching an amount by a date, the median by category and two scenarios to compare, with its limits spelled out. The same engine will then give each goal its chance of being reached on time, then a retirement projection.
Cash-flow forecasting, for its part, waits for the spending to build up enough history again since v1.0. It will be treated as a real time-series problem: a protocol written in advance, a backtest with no leakage from the future, and a naive model to beat before anything else. This page will be updated with each step shipped.
Try it#
git clone https://github.com/gwils28/kwak-finance
cd kwak-finance
make setup        # dependencies and Git hooks
make check        # everything CI runs
make up           # the full stack on https://localhost:8443
The steps to create the owner account and the encryption key are in the README, and the app
itself offers, at the bottom of every page, a guide to start, stop and update it.