1.07e-5
gap to the library
+2.3%
regional MASE
356
backtested origins
Transparency note. This work was carried out on a personal basis, for learning purposes, with the help of an AI:
- for the code and the technical and methodological review;
- to understand the tools and the mathematical methods;
- for help with writing, translating and correcting the text;
- to generate the cover image of this page.
The choice of topic, the protocol, the checking of the results and the conclusions are mine, and so are any mistakes. How I use AI
This repository is the lab behind the post Hierarchical forecast reconciliation: promises and limits. The post tells what I learned; this page shows how the work is organised and how to reproduce it. The repository and its figures are in French.
The goal#
Forecasts produced series by series don’t add up: the regions don’t sum to the national total, and someone has to arbitrate. Reconciliation (MinT first) promises to remove that arbitration. I wanted to find out three things:
- write the projection
P = S(S'W⁻¹S)⁻¹S'W⁻¹by hand, and match the library to the digit; - find where MinT breaks: bias, quantiles, the numerical wall;
- check on real data whether reconciliation improves accuracy, or only coherence.
The approach#
The work follows six blocks, one folder each. The code lives in a single package
(src/w37_reconciliation), the teaching notebooks call it, and each block has its README
(results) and its TUTORIEL (how to rerun it).
- 1
Research
Four 2026 papers checked, a three-point summary and a note on what is overrated: reconciliation sold as an accuracy gain. - 2
MinT from scratch
Schäfer–Strimmer shrinkage, oblique projection, three assertions. Gap to HierarchicalForecast: 1.07e-5. It does not come from λ, as the plan assumed, but from the covariance estimator (centring and dividing by T−1). - 3
System design
A materialised batch job with a versioned YAML contract, a hash of the hierarchy and a quality gate that blocks publication. - 4
Fundamentals
MinT spreads the bias of a single forecast to every leaf. Applied to quantiles, it gives a vector that is coherent and wrong: 0.764 coverage instead of 0.900. Only joint sampling is calibrated. - 5
éCO2mix mini-project
12 regions → France, RTE data 2013-2024, rolling-origin backtest, then a benchmark against naive forecasts and RTE’s own forecast, and three confirmation studies. Details below. - 6
BayesReconPy
On intermittent sales (M5), Gaussian MinT produces negative sales; Bayesian conditioning produces none, and is the most accurate.
The éCO2mix mini-project#
The business goal: deliver electricity demand forecasts where the 12 regions add up exactly to the France total.
The protocol, fixed before the results in configs/eco2mix.yaml:
- hourly data;
- SeasonalNaive(168) and MSTL as base models;
- a 52-week training window, strictly before each origin;
- a 24 h horizon;
- five reconciliations, compared by MASE level by level.
The main result#
The result comes in two steps. On the 4 origins of the main protocol, MinT shrink seemed to win (−2.2% regional MASE). Over 119 origins covering all of 2024, it does worse than bottom-up, on all 13 series.
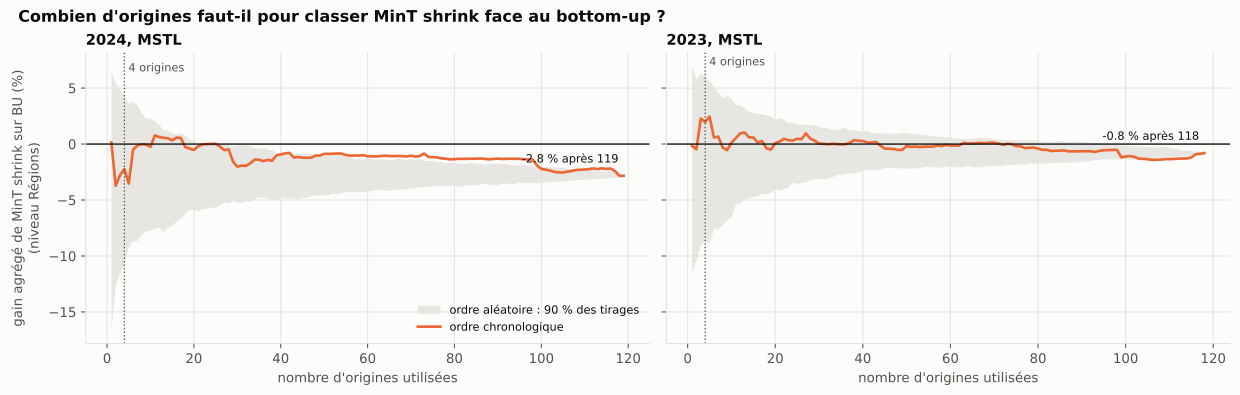
The cause is shown by a controlled experiment. MinT estimates its W matrix on in-sample residuals. MSTL’s are smoothing leftovers, correlated at 0.11 across regions, while the real errors are correlated at 0.56. Estimated on the errors of past origins instead, W brings MinT back level with bottom-up (−0.1%, not significant).
The benchmark: where the gain comes from#
A ranking between reconciliations says nothing about what they are worth against doing nothing. So I put the five reconciliations into a full benchmark: four naive baselines (last value, 4-week average, same hour last week or the day before), MSTL alone, and RTE’s official day-ahead forecast. The latter is not a like-for-like competitor: it uses the weather forecast. As published, it also underestimates demand by about 1.1 GW throughout; a debiased version removes its mean error over the previous 52 weeks, with no leakage.
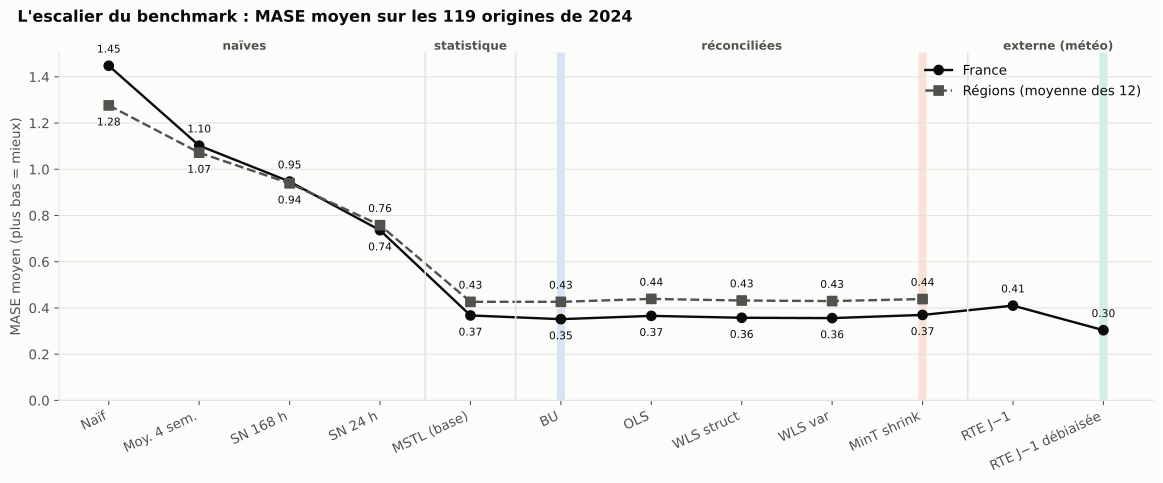
The staircase reads in three steps:
- The statistical model does almost everything. MSTL divides the seasonal naive error by 2.6 at France level (61% gain).
- Reconciliations form a plateau. Their France MASE ranges from 0.352 to 0.370, and bottom-up is its low point, at both levels. Reconciliation moves the error by a few percent; the base model had moved it by 60%.
- Only the weather goes below the plateau. The debiased RTE forecast is 13.6% better than bottom-up in 2024, and 12% in 2023.
The ranking does not depend on the metric: it is the same in MASE, MAE (MW), RMSE and MAPE. It does depend on the hour being forecast, and that is the newest result.
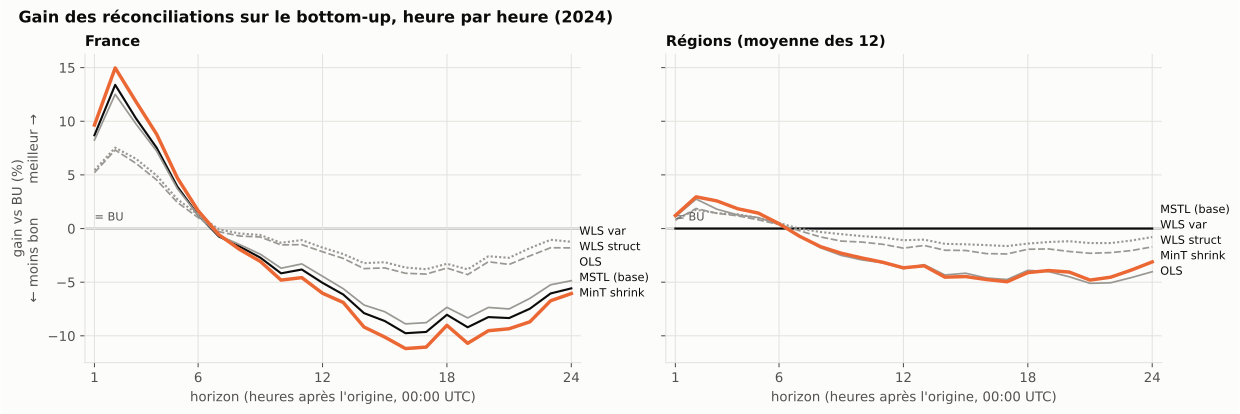
At France level, the direct MSTL forecast of the total and MinT shrink beat bottom-up by 7.5% and 8.6% over hours 1 to 6: right after the origin, the last known value of the total is very informative, and MinT gives it weight. Further out, the total’s forecast drifts, while the sum of 12 regional forecasts cancels part of their errors. A day has 6 favourable hours and 18 unfavourable ones: bottom-up wins on average. For an intraday forecast, the conclusion could flip.
Three confirmation studies#
Added after the results, these studies change one thing at a time and keep the rest of the protocol:
- Another year. Over 118 origins in 2023, the staircase is the same and MinT shrink still loses to bottom-up (−0.8% regional, −1.5% France), but the gaps are three times smaller and none is significant after Holm.
- Another base model. The W explanation makes a testable prediction: with a model whose in-sample residuals are genuine one-step errors, MinT’s handicap should vanish. AutoETS is a filter that only looks at the past. It is much less accurate than MSTL (France MASE 0.64 vs 0.37), but MinT’s handicap vanishes: −0.0% regional.
- The cause, replayed. Estimating W on the errors of past origins also erases the handicap in 2023 (−1.0% → −0.3% regional). From 3 to 99 past origins, MinT stays within ±3% of bottom-up: there is no magic window, it just needs real errors.
The direct measurement of the mechanism fits in one table:
| Base model | Correlation seen by W (in-sample) | Real correlation (out of sample) | MinT shrink vs BU (regions) |
|---|---|---|---|
| MSTL | 0.11 to 0.13 | 0.56 | −2.8% |
| AutoETS | 0.49 to 0.57 | 0.66 | −0.0% |
When W sees correlations close to reality, MinT loses nothing. When it sees nearly independent regions while they actually err together, MinT spreads its corrections badly. With a good W, it still does no better than bottom-up.
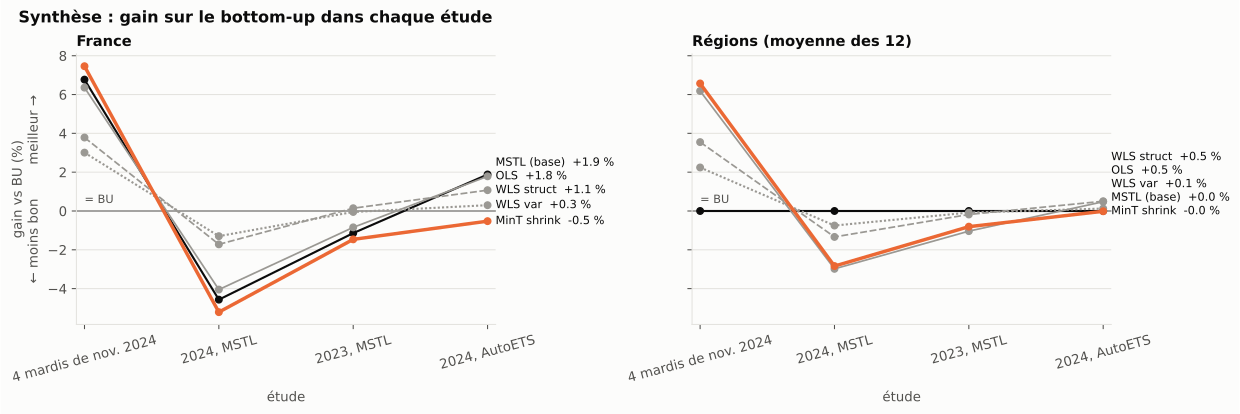
The verdict: over 356 origins and two base models, bottom-up is never beaten significantly. What weakens is the size of the effect: in 2023 or with AutoETS, choosing between BU, WLS and OLS makes almost no difference.
What got in the way#
- Data before models. Nouvelle-Aquitaine stops at the end of 2024. The source also has a daylight-saving defect every year: duplicates in March, a missing hour in October. A missing row raises no error, it silently skews the total.
- 4 origins rank nothing. Drawing origins at random, MinT’s gain over bottom-up ranges from −10.8% to +4.3% with 4 origins. It takes 22 in 2024, and 96 in 2023 where the gap is smaller, for every draw to give the same sign. Hence paired tests with Holm correction before concluding.
- An average of ratios can lie. Against bottom-up, the debiased RTE forecast is 13.6% better in aggregate gain, but 51.6% worse in average per-origin gain: on calm days, bottom-up’s error is tiny and the ratio blows up. To compare very different methods, compare averages of errors, not averages of ratios.
- The naive λ doesn’t scale. The
T × m × mtensor weighs 31 GB at m = 5,000. Going through theT × TGram matrix brings that down to 0.6 GB, with the same result. - Check a package before recommending it. BayesReconPy 0.5.0 no longer installs as is (PuLP 4), and its licence is contradictory.
What I take away#
- Coherent doesn’t mean calibrated, nor more accurate: MinT guarantees coherence, the rest is a bonus.
- On a flat, highly correlated hierarchy, bottom-up is the most accurate choice and the easiest to defend: it is never beaten significantly, over two years and two base models.
- The lever is the base model and the information it gets: the weather is worth more than any reconciliation.
- A hidden assumption (in-sample W) can overturn a result: test it, don’t assume it. Here, three independent experiments point to the same cause.
- A conclusion is confirmed by changing one thing at a time: the year, the model, the way W is estimated.
Reproduce#
git clone https://github.com/gwils28/W37_hierarchical_reconciliation
cd W37_hierarchical_reconciliation
uv sync && uv run pytest   # 100 tests: 89 unit, 11 end-to-end
make eco2mix               # downloads the RTE data, backtest, report
make eco2mix-robustness    # 119 origins in 2024 (≈ 40 min)
make eco2mix-confirmation  # 2023, then AutoETS on 2024 (≈ 25 min)
Data: Open Data Réseaux Énergies (ODRÉ) — RTE, Licence Ouverte v2.0.